A closer look at family films and television.
Explore original TFFC studies, thoughtful analysis and seasonal findings about the films and series families watch.
Explore how family films have changed, what children's television offers, and how viewing experiences differ. Every study includes the sources behind its findings.
Findings worth a closer look
How the Family Christmas Movie Changed
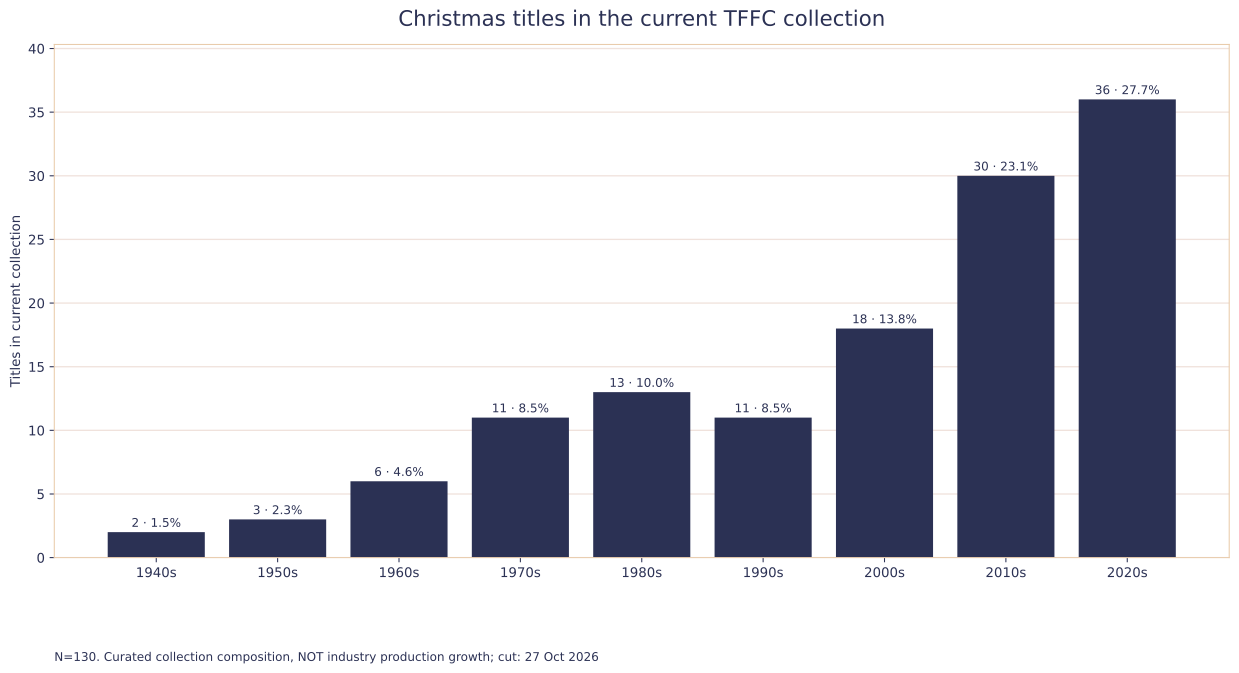
In the 130 titles currently mapped to TFFC’s Christmas collection, live action remains the largest single format, while animation, stop motion and hybrids contribute a substantial share. Family, Kindness and Belief are the most frequent editorial theme tags. This is an updated snapshot of a curated collection, not a measure of Christmas film production across the industry.
Are Family Movies Getting Longer?
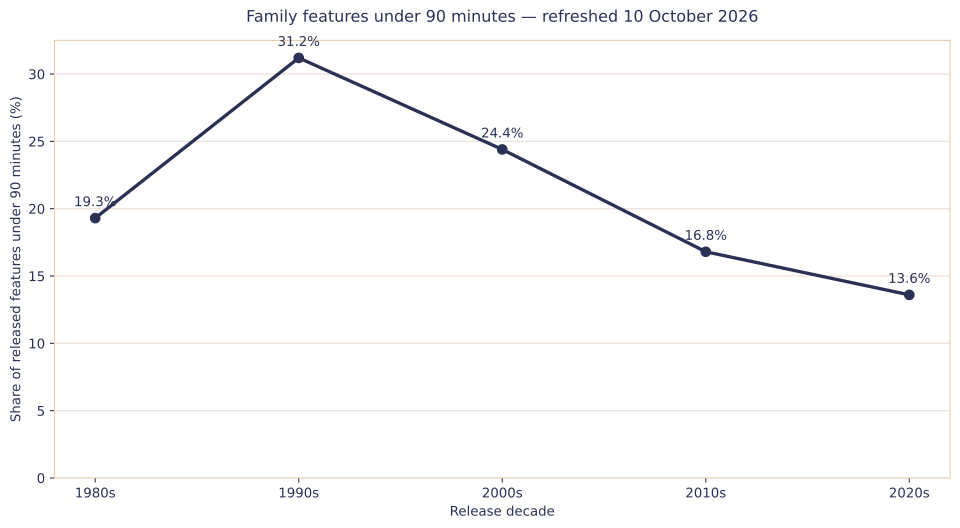
Not in a simple straight line. Across 1,132 released feature-length films in The Family Film Collection, the clearer change is that short family features have become much less common. Films under 90 minutes account for 31.2% of the 1990s cohort, but only 13.6% of the 2020s cohort through 10 October 2026.
From Cinema to Streaming: How Family Animation Changed Its First Release Route
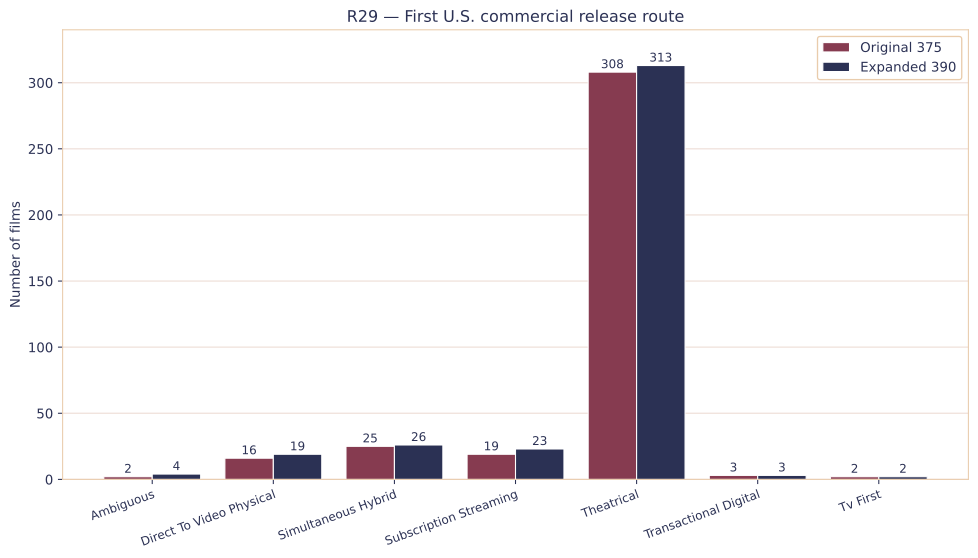
For decades, family animation had one obvious first stop: the cinema. A 375-film TFFC census shows when that changed — and why the 2020s are not simply a streaming-takeover story.
Choose what you want to explore
Original Research
Original studies of the TFFC film catalogue, from viewing time and film history to age guidance. Each study explains which titles were examined and how the findings were reached.
Browse original studies02Expert Insights
In-depth articles that connect published research with TFFC's editorial perspective, making clear what the sources show and how the findings are interpreted.
Browse expert insights03Seasonal Data Briefs
Studies of family films and seasonal trends, with clear dates and sources for every finding.
Browse seasonal briefsAll 29 research pages
Browse by title or topic. Every study presents its findings, explains how they were reached, and cites the sources.
Are Family Movies Getting Longer?
Not in a simple straight line. Across 1,132 released feature-length films in The Family Film Collection, the clearer change is that short family features have become much less common. Films under 90 minutes account for 31.2% of the 1990s cohort, but only 13.6% of the 2020s cohort through 10 October 2026.
How CGI Became the Dominant Technique in Family Animation
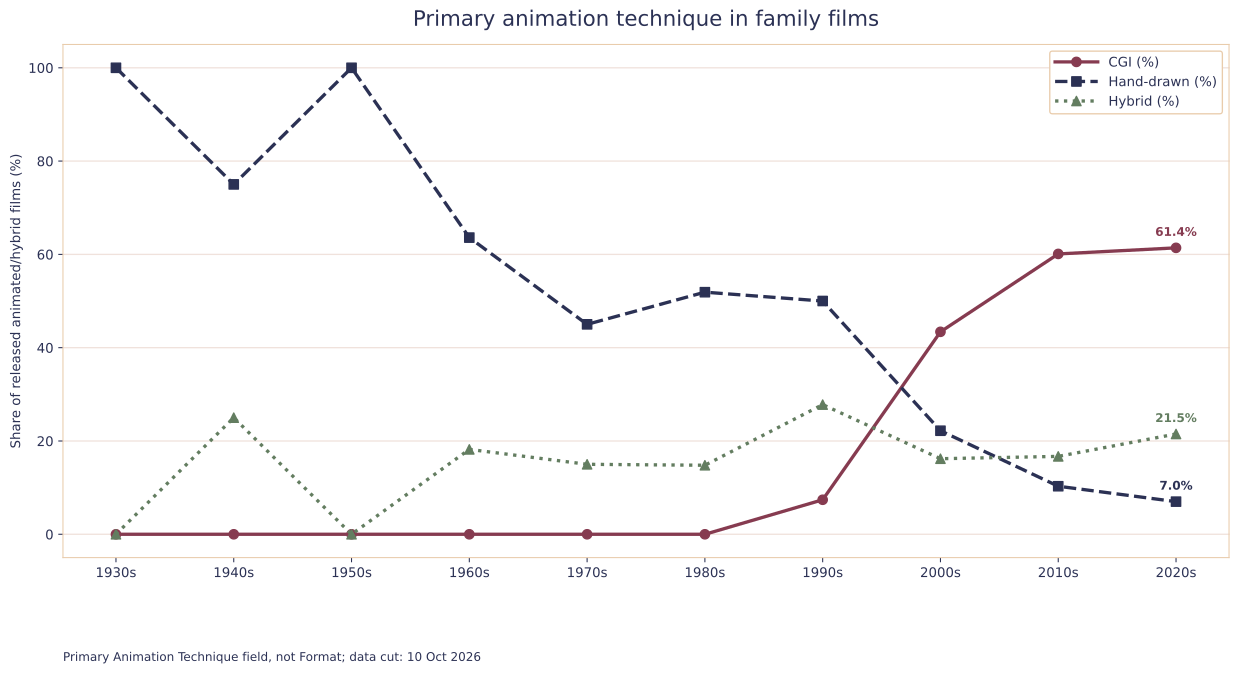
In TFFC’s released animated and hybrid catalogue, CGI rises from 7.4% of primary animation-technique classifications in the 1990s to 61.4% in the 2020s through 10 October 2026. Over the same comparison, the primary Hand-drawn classification falls from 50.0% to 7.0%.
90 Years of Family Movies: How the Mix Changed
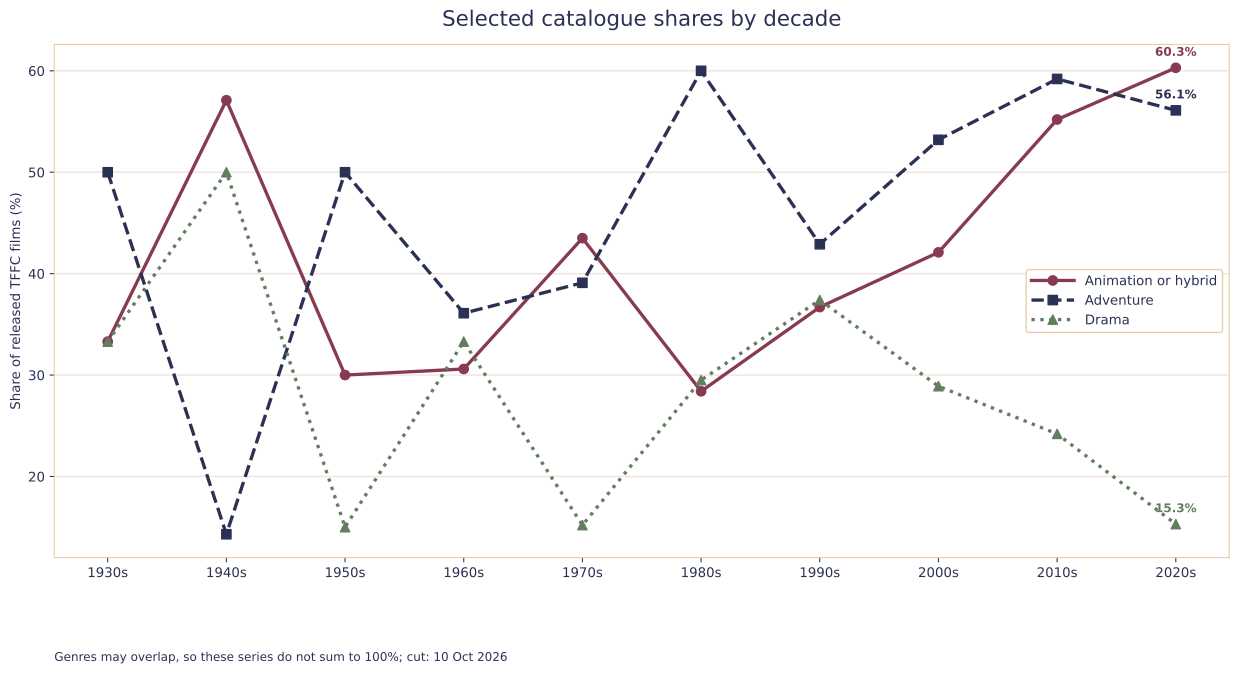
Across 1,229 released films in The Family Film Collection, the balance of format and genre looks very different in the 2020s than it did in the 1990s. Animation occupies a larger share, adventure and fantasy are more prominent, and drama accounts for a smaller part of the catalogue.
Where Did the G Rating Go?
In the released TFFC catalogue, G falls from 27.3% of standard MPA-rated family films in the 1990s to 2.1% in the 2020s through 30 September 2026. PG now accounts for 72.2% of that newer cohort.
What Does PG Actually Mean for Families?
Across 590 released PG films in The Family Film Collection, TFFC’s Minimum Age guidance ranges from 3 to 12. The median is 7. A single PG label therefore covers films that can work very differently for families.
Family Movies Are Much More Likely to Continue an Existing Screen Series
Continuing screen and franchise entries account for 15.2% of released TFFC films from the 1990s and 34.8% of the 2020s cohort through 30 September 2026. A narrower definition based only on explicit continuation wording shows the same direction.
Why a Film with a Steadier Pace Can Still Be for Older Kids
Of 60 released films selected for a steadier pace and also meeting the No Scary Parts and Low Conflict criteria, 21 (35.0%) have a Recommended Age of 9+. A measured story rhythm does not by itself determine age suitability.
What Happened to “Good vs Evil” in Family Movies?
The TFFC Good vs Evil theme tag appears on 22.1% of released films from the 1980s, 7.5% from the 1990s and 3.8% from the 2020s. The decline is clear. Interpreting what replaced it is more complicated because TFFC’s newer films carry more theme tags on average.
No Parent Death Is Not the Same as No Death
As of 10 November 2026, current PASS decisions and memberships agree: 711 films without parent death, 1,042 without animal death and 485 without death. These are collection qualifications, not incidence rates.
Short-Form Story Units Are Much More Common in Children’s TV
In TFFC’s current 411-series TV catalogue, stored runtimes of 15 minutes or less account for 19.1% of the 1990s cohort, 23.8% of the 2000s, 41.0% of the 2010s and 42.0% of the 2020s. The shift is real, but “episodes keep shrinking” is too simple a description.
Beyond Screen Time: Why Content, Context and Co-Viewing Matter
A timer can measure duration. It cannot tell you what a child watched, why they watched it, what else was happening around them, whether an adult joined in, or what the media replaced. Current pediatric guidance and recent research increasingly treat those differences as central, not secondary.
What Does Educational TV Actually Teach?
TFFC’s educational-guide TV set contains 87 series across six principal learning focuses. STEM and problem-solving lead with 25 series, followed by social-emotional learning with 22. The labels describe what programmes work on; they are not proof that every child who watches achieves a measured learning outcome.
From Educational Television to Educational Media
Educational children’s television did not simply move from broadcast to streaming. The larger change is that the learning experience expanded across television, games, apps, websites and other digital media — while television remained part of the system.
How the Family Christmas Movie Changed
In the 130 titles currently mapped to TFFC’s Christmas collection, live action remains the largest single format, while animation, stop motion and hybrids contribute a substantial share. Family, Kindness and Belief are the most frequent editorial theme tags. This is an updated snapshot of a curated collection, not a measure of Christmas film production across the industry.
What Share of Family Cinema Comes from Books?
Using a conservative, documented source rule, 330 of 1,088 released films in The Family Film Collection — 30.3% — have a current prose or literature source. The decade pattern is uneven: the share peaks at 31.5% in the 2000s and falls to 22.9% in the 2020s through 30 September 2026.
Is Anime Creating More Entry Points for Tweens?
Anime accounts for 36 of the 66 TFFC TV series recommended from ages 9–12 — 54.5% of that subset. Across the full 411-series current TFFC TV catalogue, anime accounts for 95 titles, or 23.1%.
What Does “Low-Stimulation TV” Actually Mean?
“Low-stimulation” can be a useful editorial description of how a program looks, sounds and moves. It should not be treated as a clinical category, a dopamine claim or a promise that a particular style will improve attention.
How Much Does Your Family Movie Shortlist Shrink When You Want a Gentler Story?
The current catalogue has 60 released films selected for a steadier pace that also meet the No Scary Parts and Low Conflict criteria. Of these, 37 also meet both the Without Parent Death and Without Animal Death criteria, while 33 additionally meet the Without Death criterion. These are counts of editorial selections, not sensory measurements.
The Halloween Scare Ladder
The current TFFC Halloween collection contains 85 titles. The original, fully adjudicated 83-film research set places 68 titles into four scare bands and leaves 15 at the boundary. Two newly added titles have not yet been assigned a scare tier, so the historic tier counts are not rates for all 85 titles.
What Makes a Good First Full-Length Movie?
28 released TFFC films with recommended age 4 or younger and runtime 60+ minutes; median 77.5 minutes. Compare pacing and viewing needs.
AI-Generated Children’s Video: The Provenance Problem
The most defensible concern about AI-generated children’s video is not that “AI content is bad”. It is that viewers may not always know how an animated video was made. As of 2 October 2026, YouTube requires creator disclosure for realistic AI-generated or meaningfully altered content, while explicitly saying non-realistic AI content does not have to be disclosed.
How TFFC's Steadier-Pace Selections Vary Across Decades
In a defined cohort of 1,090 TFFC films released from 1980 to 2025, 218 currently belong to Films with a Steadier Pace. The shares are 40 of 147 films (27.2%) from the 1990s and 28 of 245 (11.4%) from 2020–2025. These are editorial selection rates within this catalogue, not measurements of stimulation or a cinema-wide trend.
Can a Brand-Based Family Film Still Stand on Its Own?
A toy, game or consumer-property origin tells us where a film begins. It does not tell us whether the finished movie has a conflict, character arc and thematic engine that can work beyond the property mechanics. The useful question is film by film.
Were Older Family Films Gentler? It Depends on the Criterion
In fixed samples of 78 Timeless Classics and 630 newer released films, the steadier-pace selection includes 25 versus 110 titles. The Without Death counts are 22 versus 255, and No Scary Parts 15 versus 182. Different editorial viewing preferences produce different patterns.
Free Curated Children’s Programming in the U.S.: What Access Looks Like in 2026
As of 2 October 2026, PBS KIDS still provides free, no-subscription video access in the United States through local PBS stations, pbskids.org and the PBS KIDS Video app. The harder story is behind that access: a major 2025–early 2026 funding disruption cut research, staffing and outreach, while a new Ready to Learn grant cycle resumed later in 2026.
Disability and Neurodivergence in Children’s Screen Stories
Disabled characters remain uncommon in a major recent benchmark of children’s television. In the Geena Davis Institute’s 2024 samples, disabled characters make up 1.7% of characters in new children’s programming and 2.5% in popular children’s programming. Representation counts, however, are only one part of the question.
The Animated Musical Did Not Simply Disappear
What 374 animated family films show about a form that changed shape
How Often Do Family Films Become TV Series?
In TFFC’s frozen catalogue, 35 of 936 films with a complete five-year follow-up window — 3.7% — generated a qualifying TV or streaming series within five years under a strict, high-confidence Film→TV rule. Including strong mixed-provenance cases raises the result to 4.2%.
From Cinema to Streaming: How Family Animation Changed Its First Release Route
TFFC analyzed 375 animated family films to trace how U.S. first-release routes changed from theatrical dominance to direct-to-video, streaming and hybrid distribution.
Explore each topic in depth
Looking for reliable findings to cite?
Each study brings its main findings together with the date, method and sources. Readers and journalists can check the context before using the results.