What 374 animated family films show about a form that changed shape
Research ID: TFFC R27 — The Animated Musical Over Time
Data freeze: 2 October 2026
Primary denominator: 374 included core animated features from a 501-film animation-related candidate roster
The animated musical is easy to recognize when characters repeatedly sing their wants, fears, conflicts and relationships into the story. It becomes harder to classify when music remains central but the characters stop singing it themselves.
That distinction is the central finding of The Family Film Collection's R27 census. Across 374 included core animated features, 83 films — 22.2% — meet a strict narrative-musical definition. Another 64 films — 17.1% — are music-heavy without meeting that threshold. The remaining 227 films are classified as not musical.
The pattern is not a simple story of disappearance and return. Among the larger modern decade cohorts, the 1990s are the high-water mark in this dataset: 14 of 34 included films, or 41.2%, qualify as musicals. The share then falls to 14 of 73 in the 2000s (19.2%) and 18 of 143 in the 2010s (12.6%). In the 2020s cohort available through the 2 October 2026 data freeze, it rises to 18 of 89 (20.2%). That is a partial rebound from the 2010s, but it is still well below the 1990s level.
Early decades sometimes show higher percentages, but those samples are very small — only two included films in the 1930s, five in the 1940s, five in the 1950s, three in the 1960s and four in the 1970s. For historical interpretation, the larger cohorts from the 1980s onward provide a more stable comparison.
The 1990s peak — and what came after
The 1990s stand out not because every animated film became a musical, but because the form was unusually common across the films in this family-oriented corpus. Fourteen of 34 films qualify as musicals, while another eight are music-heavy. In other words, nearly two-thirds of the decade's included films either use a recurring narrative-musical form or give music an unusually prominent role.
By the 2000s, the musical share is cut by more than half, to 19.2%. Yet music-heavy films remain common: 18 of 73 films, or 24.7%, fall into the middle category. This is important because it shows why a binary musical/non-musical count can miss a meaningful change in form.
The year 1999 captures that transition unusually well. None of the five included films from that year qualify as musicals, but four are classified as music-heavy: Fantasia 2000, Tarzan, Toy Story 2 and Scooby-Doo and the Witch's Ghost. The fifth, My Neighbors the Yamadas, is not musical. The point is not that animation suddenly stopped using songs. It is that songs were often doing different work.
Why Tarzan is not counted as a musical here
R27 uses a deliberately strict definition. A film qualifies as MUSICAL only when multiple substantial song or performance numbers recur as part of the narrative form and materially carry plot, character, relationships or dramatic progression.
That rule excludes some films with famous soundtracks.
Tarzan is a key example. Its Phil Collins songs recur throughout the film and carry emotional and dramatic context, but the characters generally do not perform them as recurring dramatic scenes. Disney's own D23 account notes that Collins sang the songs rather than having the animated characters burst into song.[1] R27 therefore classifies the film as MUSIC_HEAVY_NOT_MUSICAL.
The Road to El Dorado sits in a similar space. Animation World Network reported that the film features six original songs, five sung by Elton John as narrative accompaniment and only one sung by the characters. A co-producer described the intention as moving away from the traditional song formula and making “a movie with music.”[2] Under the frozen R27 definition, that is music-heavy rather than a recurring narrative musical.
The same principle applies in the other direction. A film does not need to resemble a classic Disney princess musical to qualify. In the modern sample, KPop Demon Hunters qualifies because its songs repeatedly advance plot, character and conflict; Netflix's own production material describes the music as narrative-driven and story-forward.[3][4] The category is about function, not style.
Music did not vanish; its narrative role shifted
The distinction between MUSICAL and MUSIC_HEAVY_NOT_MUSICAL reveals a broader pattern.
In the 1990s, 23.5% of the included films are music-heavy without being musicals. In the 2000s the figure is 24.7%. Even while the share of full narrative musicals drops sharply, a substantial group of films continues to organize major sequences around songs, performance, score or soundtrack-driven storytelling.
By the 2010s, the music-heavy share falls to 16.8%, and in the 2020s-to-date cohort it is 7.9%. At the same time, the musical share rises from 12.6% to 20.2%. The modern rebound therefore does not look like a simple increase in all music-forward animation. Within this corpus, a larger share of recent titles crosses the stricter narrative-musical threshold.
2D and CGI show different associations — not a causal answer
The technique cut is also striking. Among 114 included films coded as traditional or digital 2D, 42 are musicals: 36.8%. Among 213 CGI films, 35 are musicals: 16.4%.
That gap should not be read as evidence that 2D animation causes musical storytelling, or that CGI discourages it. Technique is intertwined with release period, studio identity, franchise strategy and changing production models. R27 is descriptive, not causal.
What the result does show is that the shift from 2D-dominated to CGI-dominated family animation overlaps with a period in which the musical form became less common in this corpus. That is a useful research observation, but it requires separate analysis before any claim about why.
Disney Animation is distinctive, but Disney and Pixar are not interchangeable
Studio grouping reinforces the need for careful definitions.
Within the included core set:
- Disney Animation: 32 musicals among 60 films — 53.3%.
- Pixar: 1 musical among 31 films — 3.2%.
- Other studios: 50 musicals among 283 films — 17.7%.
Those figures make it misleading to treat “Disney” as one undifferentiated creative category. R27 therefore stores studio identity separately from corporate ownership at release.
Using the separate ownership-at-release cut, Disney-controlled films account for 39 musicals among 98 included films (39.8%), compared with 44 among 276 films not controlled by Disney at release (15.9%). That corporate-family comparison is descriptive only. It does not imply that ownership caused the musical form, and later acquisitions are not applied retroactively.
The 2020s rebound survives the Hybrid test
Hybrid animation/live-action films are deliberately excluded from the headline denominator and kept as a 107-film boundary cohort. That decision could potentially matter if modern hybrid films were disproportionately musical.
The sensitivity test shows that it does not materially change the modern pattern. In the 2010s, the musical share is 12.6% in the core-only series and 12.4% when the decade's Hybrid boundary titles are added. In the 2020s-to-date, the corresponding figures are 20.2% and 19.7%.
The broad conclusion is therefore robust to this boundary choice: the 2020s cohort shows a partial rebound relative to the 2010s, but not a return to the 1990s share.
What the data can — and cannot — say
R27 is a census of a defined TFFC family-film corpus, not every animated feature ever released worldwide. The 501-film candidate roster was frozen before trend analysis. The final headline denominator contains 374 core animated features after 20 documented core exclusions; 107 Hybrid titles remain outside the primary series and are used for sensitivity analysis.
The research also does not treat “musical” as a quality label. A film can be an outstanding animated film without being a musical, and a famous soundtrack does not automatically make a film one.
What the census can show is how often a recurring narrative-musical form appears inside a consistent family-animation corpus and how that share changes across time, studio groups and techniques.
On that measure, the pattern is clear: the 1990s are the modern large-sample high point; the form becomes much less common through the 2000s and 2010s; and the 2020s-to-date show a partial rebound. The missing middle — films that are deeply shaped by music without functioning as full narrative musicals — is essential to understanding what changed.
Sources and data
The headline statistics in this article are calculated from the frozen TFFC R27 film-level census included with this publication package. The dataset preserves the numerator, denominator, classification, evidence note and source fields at film level.
- D23, “Phil Collins”: https://d23.com/walt-disney-legend/phil-collins/
- Animation World Network, “Paving the Musical Road to El Dorado”: https://www.awn.com/animationworld/paving-musical-road-el-dorado
- Netflix Tudum, “KPop Demon Hunters: Inside the Animated Film’s Electrifying Original Songs”: https://www.netflix.com/tudum/articles/kpop-demon-hunters-soundtrack
- Netflix Tudum, “K-Pop Hitmaker Danny Chung on Crafting the Sound of KPop Demon Hunters”: https://www.netflix.com/tudum/articles/kpop-demon-hunters-danny-chung
Data assets: TFFC_R27_ANIMATED_MUSICAL_CENSUS_FINAL.xlsx and TFFC_R27_ANIMATED_MUSICAL_CENSUS_FINAL.csv.
10 October 2026 — Expanded-catalogue update
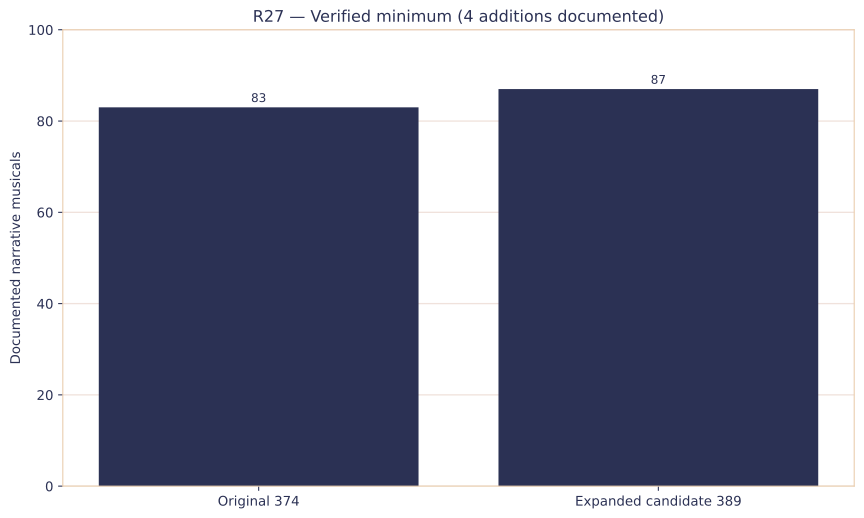
The original R27 census contains 374 core animated features, including 83 narrative musicals. The updated TFFC catalogue adds 15 feature-length animation candidates, producing a preliminary expanded cohort of 389 films. Four additions have independent supporting evidence for recurrent narrative songs: Plankton: The Movie, My Little Pony: The Movie (1986), Winnie the Pooh: A Very Merry Pooh Year and Rudolph and Frosty’s Christmas in July. That establishes at least 87 documented musicals among 389 candidates (22.4%). The separate source-and-classification table tracks the remaining decisions; this is a documented minimum rather than a final musical-prevalence estimate.